Showing posts with label economy. Show all posts

Thursday, November 17, 2011

Initial Claims 11-17 - My 2 Cents

From the initial claims release this morning:
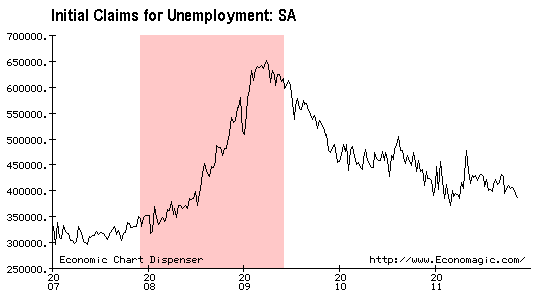
In the week ending November 12, the advance figure for seasonally adjusted initial claims was 388,000, a decrease of 5,000 from the previous week's revised figure of 393,000. The 4-week moving average was 396,750, a decrease of 4,000 from the previous week's revised average of 400,750.

The advance number of actual initial claims under state programs, unadjusted, totaled 360,139 in the week ending November 12, a decrease of 42,355 from the previous week. There were 409,548 initial claims in the comparable week in 2010.

States reported 2,935,466 persons claiming EUC (Emergency Unemployment Compensation) benefits for the week ending October 29, a decrease of 18,358 from the prior week. There were 3,961,485 claimants in the comparable week in 2010. EUC weekly claims include first, second, third, and fourth tier activity.
We seem to be getting some traction in reducing the number of initial claims, which should begin to help prop up employment figures.  While not an out of the park number, it is a decent sign - especially when combined with the reduction in EUC and EB.


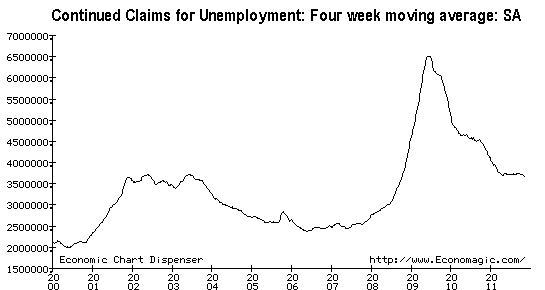
Now we have to make a more meaningful impact on the continuing claims series.


All in all, I think this should be taken as a modestly positive sign for the US economy.  Absent the problems in Europe, Treasuriy prices should drift lower (higher yields) given the firming employment picture.  Unfortunately, we can't invest "absent the turmoil in Europe" so it is still too early to set a short in UST.  This may, however, reinforce the premise that corporate America is solid credit iis still a decent play (the equity market is dictated by the European whack-a-mole).

Thursday, February 10, 2011

Inflation - Evidence Continues to Mount

Thought the following story on DJN was interesting.  All we keep hearing is that inflation is low and contained and as a result, we don't need monetary policy shifts.  I beg to differ.  Inflation is indeed out there and is beginning to be pushed onto the consumer.  This will be evident enough shortly.  As a result, stay flat to short duration and overweight spread product.


(Dow Jones)- Major consumer goods companies are being forced to reassess their business models in the face of soaring commodity costs as they attempt to minimize damage to profit margins and scale back losses.
Whether through raising prices, cutting costs, adjusting product size or altering ingredient mix, companies such as Unilever PLC (ULVR.LN), Reckitt Benckiser (RB.LN) and Kraft Foods Inc. (KFT) are all having to take action as rising input costs show no sign of abating.
As escalating costs have hit all categories of commodities, no single company is better placed than another, so their differing strategies will be under close scrutiny.
 Unilever predicted a 400 basis point hit to full-year margin due to escalating commodity costs while U.S. rival Procter & Gamble (PG) said earlier this month its commodities bill will total $1 billion for the year to the end of June, more than double expectations.
 One needs look no further than the rise in ten and thirty year treasuries and the steepening of the curve.  Ben, do you shop?

Wednesday, December 22, 2010

Third Quarter GDP - My Take

Ok, GDP out this morning - everyone and their brother will be analyzing and pontificating on this, so I will leave most of it to them.  I will, instead, just focus on what I am looking at in the release.  The bottom line, in my view, is that growth is decent but not truly robust.  Numbers are no longer coming off a significantly weak base.  I am still cautious in my expectations, but not gloomy nor pessimistic. 

Profits from current production (corporate profits with inventory valuation and capital consumption adjustments) increased $26.0 billion in the third quarter, compared with an increase of $47.5 billion in the second quarter.  Current-production cash flow (net cash flow with inventory valuation adjustment) -- the internal funds available to corporations for investment -- decreased $68.4 billion in the third quarter, in contrast to an increase of $61.1 billion in the second.
Ok, we have to expect a slowdown from the 2nd Q pace, but this is a little much.  The funds available for investment is especially troubling as cost cutting measures cannot propel growth much longer.   But the bright spot:

Domestic profits of financial corporations increased $34.6 billion in the third quarter, in contrast to a decrease of $3.4 billion in the second.  Domestic profits of nonfinancial corporations increased $0.3 billion in the third quarter, compared with an increase of $48.2 billion in the second.  In the third quarter, real gross value added of nonfinancial corporations decreased.
I am still keen on the banks across the capital structure as I do not believe risk premiums fully reflect the improvements to the business and the capital positions.  I primarily focus on the bigger banks as many of the regionals  have more work to do.  Now, with that in mind, we still have BASEL to contend with and coming regulation that could diminish trading profits and reduce profits on the retail side.

Now, for me the tricky part is deciphering the following:

The change in real private inventories added 1.61 percentage points to the third-quarter change in real GDP, after adding 0.82 percentage point to the second-quarter change.  Private businesses increased inventories $121.4 billion in the third quarter, following increases of $68.8 billion in the second quarter and $44.1 billion in the first.
 Was the inventory build in expectation of future sales or as a result of lower than expected sales?  I have to think it is a combination of the two, judging from Q3 conference calls.  Corporate leaders did not show the bubbly confidence one would expect if they were building inventories for future growth.

Tuesday, December 14, 2010

Small Business Confidence Up

Another datapoint which supports a nascent recovery across business size in the US.  Should this continue, it will drive outperformance to lower cap securities as we have been positing.  While always subject to revision, this is yet another peice in the outlook.

(Bloomberg) Confidence among U.S. small businesses rose in November to the highest level since the recession began three years ago as more companies projected the economy and sales will improve, a private survey found.
The National Federation of Independent Business’s optimism index increased to 93.2, the highest since December 2007, from an October reading of 91.7. Seven of the index’s 10 components rose and three declined. The measure averaged 100.7 during the previous expansion.
 The gauge of expectations for better business conditions six months from now rose to the highest level since June 2005, jumping 8 points to 16 percent in November, the report showed.
The measure of hiring plans over the next three months rose three points to a net 4 percent, according to the NFIB report. Nine percent of businesses said they intend in increase staff, up one percentage point from the prior month. Fewer indicated they plan to cut payrolls, with 12 percent anticipating workforce reductions, down from 13 percent in October. 
At the same time, the sales trends are not yet “supportive of a widespread recovery in the small business sector even if a bit stronger than October,” Dunkelberg said. Weak sales continued to be businesses’ top problem, with 30 percent of respondents listing it as their main concern.
“The historically high percent of owners who cite weak sales means that, for many owners, investments in new equipment or new workers are not likely to pay back,” Dunkelberg said. “This is a major cause of the lack of credit demand observed in financial markets.” 
Here's a 5yr snapshot of the index:

Wednesday, December 8, 2010

Unofficial China on the US and the Dollar

We have heard from Mr. Daokui before, and this is not the first time he has said something along these lines.  My concern is that the PBOC starts acting on his advice.  Admittedly, they have nowhere to go right now, but Li has a point, when Europe is better, they will be able to attract capital from China.  What will we do without our biggest buyer?

CNBC (yeah, I know):

The U.S. dollar will be safe for the next six to 12 months, because global markets are focused on the euro zone's troubles, Chinese central bank adviser Li Daokui said on Wednesday when asked about U.S. President Barack Obama's plan to extend tax cuts for all Americans.  
But Li, an academic adviser on the People's Bank of China monetary policy committee, said the fiscal health of the United States was in fact worse than Europe's, and that U.S. bond prices and the dollar would fall when the European economic situation stabilizes.
He was speaking on the sidelines of a financial forum in Beijing.

Tuesday, December 7, 2010

Manpower Survey - Not Bad is Good

I continue to believe that we are seeing a nascent job recovery market in the United States and, in fact, globally (with some notable exceptions - PIIGS).  While I do not see this as robust - in any way - at this juncture, the bleeding needs to stop before the patient can be stabilized and this is where I believe we are.

Should this be the case, it will be evidence that we are in the midst of a recovery and give some credence to the risk appetite that we have witnessed.

From Manpower:

Results for the first quarter 2011 global Manpower Employment Outlook Survey released today byManpower Inc. suggest a more positive start to the new year for the global labor market. Data reveals improved hiring expectations from 12 months ago in 28 of 39 countries and territories, including the G7 countries of Canada, France, Germany, Italy, Japan, the United Kingdom and the United States, where hiring plans are stable or improved from both the fourth quarter of 2010 and this time last year. Despite continued mixed results across Europe, German employers are reporting their strongest hiring plans since early 2008. Meanwhile, hiring intentions among U.S. employers remain modest but signal the most optimistic first-quarter outlook in three years. Job prospects continue to be robust across the Asia Pacific region with Chinese and Indian employers reporting the most optimistic hiring intentions globally.
"The bright spot in Europe continues to be Germany, where the unemployment rate is at its lowest in 18 years and engineers and financial professionals continue to be in high demand. In fact, the hiring forecast from Finance and Business Services employers is the strongest first-quarter outlook since we began surveying the German market in 2003," said Joerres. "In contrast, employer hiring confidence in the Greek and Spanish markets continues to erode. However, data for Italy shows improved hiring expectations for the third consecutive quarter resulting in the first positive forecast from Italian employers in more than two years." 
 "Seasonally adjusted data for the United States indicates the most optimistic first-quarter hiring sentiment in three years; yet 73 percent of employers indicate they will keep staff levels unchanged," said Joerres. "So while we're seeing positive signals in the data, only time will tell if we've reached the inflection point in the U.S. labor market recovery. 

Thursday, December 2, 2010

Initial Claims for Week Ended Nov. 27

Claims came in above expectations and prior week numbers were revised up 3k.  Not a huge miss, but could be a set up for disappointing action should the ECB not announce massive Euro QE.  Should Euro QE (in size and unsterilized) be announced, this number becomes irrelevant.

DOL:

In the week ending Nov. 27, the advance figure for seasonally adjusted initial claims was 436,000, an increase of 26,000 from the previous week's revised figure of 410,000 (revised from 407k). The 4-week moving average was 431,000, a decrease of 5,750 from the previous week's revised average of 436,750. 
States reported 3,944,168 persons claiming EUC (Emergency Unemployment Compensation) benefits for the week ending Nov. 13, an increase of 142,874 from the prior week. There were 3,781,434 claimants in the comparable week in 2009. EUC weekly claims include first, second, third, and fourth tier activity.  Extended benefits rose 92k to 955.9k (unadjusted).

Friday, November 5, 2010

Nonfarm - Good Number, Couple of Thoughts

BLS Data released (otherwise known as non-farm).  I won't go deep on this as everyone does.  Thought the number was good and supports my "getting better" thesis. I will reiterate that the number looked good and supports recent "off the bottom" data and I will not be a "doom and gloomer" and try to punch holes.  That said, there are some points we have to understand.

First the pic, then the thoughts:

Thoughts:
Temp and retail the biggest gainers.  We are focused on quantity, not quality, something to think about.  Where does growth come from?  Job gains are not all created equal. 

Thoughts:
The unemployed are unemployed for longer periods.  This is not a great sign, and dovetails with my theory that employment gains take on a LIFO basis (last in to unemployment are the first out of unemployment) which is supported by the increase in EB and EUC.

Thoughts:
The trend in discouraged workers and those working part-time for economic reasons (kinda piggybacks with the retail/temp increase) is discouraging.  Lets not forget that discouraged workers fall out of the unemployed stats.  Admittedly, I am torn on the whole marginally attached subset.  You want a job but only looked a couple times (or not at all) during the last 12 months?  Really?  Last I checked, jobs don't go door-to-door looking for you.  Get up, get out and look.  (sounds mean perhaps, but too bad - its my blog)


Thursday, November 4, 2010

Jobless Claims Thursday - Above Expectations, Watch EUC

From the Labor Dept (emphasis mine):

In the week ending Oct. 30, the advance figure for seasonally adjusted initial claims was 457,000, an increase of 20,000 from the previous week's revised figure of 437,000 (revised from 434k). The 4-week moving average was 456,000, an increase of 2,000 from the previous week's revised average of 454,000 (revised from 453k).
The advance seasonally adjusted insured unemployment rate was 3.4 percent for the week ending Oct. 23, a decrease of 0.1 percentage point from the prior week's unrevised rate of 3.5 percent.
The advance number of actual initial claims under state programs, unadjusted, totaled 419,351 in the week ending Oct. 30, an increase of 10,881 from the previous week. There were 482,612 initial claims in the comparable week in 2009.
The advance unadjusted insured unemployment rate was 3.0 percent during the week ending Oct. 23, unchanged from the prior week. The advance unadjusted number for persons claiming UI benefits in state programs totaled 3,719,209, a decrease of 45,084 from the preceding week. A year earlier, the rate was 3.7 percent and the volume was 4,932,036.
States reported 3,978,374 persons claiming EUC (Emergency Unemployment Compensation) benefits for the week ending Oct. 16, an increase of 198,579 from the prior week. There were 3,496,960 claimants in the comparable week in 2009. EUC weekly claims include first, second, third, and fourth tier activity. 


Interesting tidbit:  CA reported +3.7k increase in unemployed, stating "Layoffs in forestry, fishing, and agriculture."  Hasn't agriculture been on fire?  Forestry continues to concern me as we have seen lumber prices increasing with no corresponding increased activity in forestry.

Bottom line:  Numbers were above expectations, prior numbers revised marginally upwards.  Doesn't jive with the ADP numbers.  Doesn't bode well for tomorrow's number.  BUT, I continue to believe we are seeing the bottom and will begin to build from here (especially with QE2 - NOT) in a very slow and sometimes choppy way.  The numbers that concern me most are the EB and EUC numbers, which point to increased duration of unemployment (something I can personally vouch for).  Unfortunately I think we will see a LIFO style re-employment trend - last into the unemployment pool will be the first out of the pool.  This will also jam the numbers as more folks will drop from the statistics as discouraged workers.

Wednesday, November 3, 2010

ISM - Stability/Growth Thesis Developing

ISM report this morning (underline mine):


Economic activity in the non-manufacturing sector grew in October for the 10th consecutive month, say the nation’s purchasing and supply executives in the latest Non-Manufacturing ISM Report On Business.
 
"The NMI (Non-Manufacturing Index) registered 54.3 percent in October, 1.1 percentage points higher than the 53.2 percent registered in September, and indicating continued growth in the non-manufacturing sector at a slightly faster rate. The Non-Manufacturing Business Activity Index increased 5.6 percentage points to 58.4 percent, reflecting growth for the 11th consecutive month at a substantially faster rate than in September. The New Orders Index increased 1.8 percentage points to 56.7 percent, and the Employment Index increased 0.7 percentage point to 50.9 percent, indicating growth in employment for the second consecutive month and the fourth time in the last six months. The Prices Index increased 8.2 percentage points to 68.3 percent, indicating that prices increased significantly faster in October. According to the NMI, 11 non-manufacturing industries reported growth in October. Respondents’ comments remain mixed about business conditions and vary by industry and company. The trend of the overall comments indicates that there are signs of economic stabilization.” 

My takeaways (non-headline):
  • Inventory sentiment better;
  • Employment better in non-manufacturing and manufacturing;
  • Backlog in non-manufacturing better
Hard to find significantly negative data here.  Signs are pointing to better times (alleviating the real need for QE, but we'll probably get it anyway here in the US).

More:

Commodities Up in Price
Airline Tickets; Beef; Cable and Cable Products; Coated Freesheet; Computer Accessories; Copper (2); Cotton Products (2); Dairy; #1 Diesel Fuel; #2 Diesel Fuel (4); Fuel (10); Gasoline; Lumber Products; Pork; and Rebar.
Commodities Down in Price
Consulting Services; and Shingles.
Commodities in Short Supply
Coated Groundwood (4); and Telephone Components. 

What is interesting here:  Lumber is up in price, but the three industries reporting contraction in October are: Agriculture, Forestry, Fishing & Hunting; Arts, Entertainment & Recreation; and Construction.  Is the increase in lumber prices signaling an increase in construction and timber prices (forestry)?

The industries reporting a reduction in employment in October — listed in order — are: Arts, Entertainment & Recreation; Agriculture, Forestry, Fishing & Hunting; Finance & Insurance; Accommodation & Food Services; Transportation & Warehousing; Construction; Wholesale Trade; and Professional, Scientific & Technical Services.  This sucks for out-of-work credit/investment guys like me.  Seriously, this is getting old.  Too much experience?  Really?

Prices paid by non-manufacturing organizations for purchased materials and services increased in October at a significantly faster rate than in September. ISM’s Non-Manufacturing Prices Index for October registered 68.3 percent, 8.2 percentage points higher than the 60.1 percent reported in September. In October, the percentage of respondents reporting higher prices is 32 percent, the percentage indicating no change in prices paid is 65 percent, and 3 percent of the respondents reported lower prices. Something inflationary this way comes?

In October, 13 industries reported an increase in prices paid, in the following order: Wholesale Trade; Arts, Entertainment & Recreation; Accommodation & Food Services; Information; Mining; Construction; Educational Services; Utilities; Transportation & Warehousing; Finance & Insurance; Public Administration; Retail Trade; and Professional, Scientific & Technical Services. No industry reported prices as decreasing for the month of October. Five industries reported no change in prices for the month of October. 

The ISM Non-Manufacturing Inventory Sentiment Index in October registered 61.5 percent, which is 2 percentage points higher than the 59.5 percent reported in September. This indicates that respondents believe their inventories are too high at this time.
Bottom line:  Numbers look okay and are supportive of growth.  That said, remember this is survey stuff and the sample does not always reflect the population.  Stability/growth thesis continues to develop.

ADP - More Evidence of Stability

U.S. companies added to payrolls more than expected in October, slightly boosting optimism about the job market ahead of Friday's government employment report.

U.S. private employers added 43,000 jobs in October compared with a revised loss of 2,000 jobs in September, payrolls processor ADP Employer Services, which developed the report with Macroeconomic Advisers LLC, said on Wednesday. The September figure was originally reported as a loss of 39,000.  The October number came in well above expectations for a rise of 20,000 private-sector jobs, based on a median of estimates from 35 economists surveyed by Reuters.


Separate data on Wednesday showed the number of planned layoffs at U.S. firms rose slightly in October, but the overall pace of downsizing for the year is down 62 percent from last year, a report said on Wednesday. Employers announced 37,986 planned job cuts in October, up 2.2 percent from 37,151 cuts in September, according to the report from consultants Challenger, Gray & Christmas, Inc.

It is beginning to look like we have actually turned the corner on jobs.  While it is en vogue to look for holes and attribute biases and skews, we are seeing the tide turn.  This should ultimately help justify the current level of the domestic equity markets and help the credit markets keep from backing off in a significant way (credit risk, not systemic duration risk).

Thursday, October 21, 2010

Jobless Claims Thursday

From the release:

In the week ending Oct. 16, the advance figure for seasonally adjusted initial claims was 452,000, a decrease of 23,000 from the previous week's revised figure of 475,000 (was 462k). The 4-week moving average was 458,000, a decrease of 4,250 from the previous week's revised average of 462,250. Okay, decreased 23k from a number revised higher by 10k.  Ummm, right.

The advance number for seasonally adjusted insured unemployment during the week ending Oct. 9 was 4,441,000, a decrease of 9,000 from the preceding week's revised level of 4,450,000. The 4-week moving average was 4,478,000, a decrease of 23,250 from the preceding week's revised average of 4,501,250.

States reported 4,040,113 persons claiming EUC (Emergency Unemployment Compensation) benefits for the week ending Oct. 2, an increase of 152,112 from the prior week. There were 3,428,585 claimants in the comparable week in 2009. EUC weekly claims include first, second, third, and fourth tier activity. Okay, more folks have fallen onto the Fed's books because they have been unemployed for so long.

Extended Benefits were reported at 1,033,717, up 126,419 from the prior weeks 907,298. See above, but substitute state for Fed.


This is better than expected?  Hardly.  This just helps support the further debasement of the currency (oops, that would be an issue we are chastising China for) I mean QE2.

Monday, October 18, 2010

Industrial Production - Its not the Number, Its the Trend

IP and CU released today.  Below estimates but look closer and skip the data point to data point nonsense.

Industrial production decreased 0.2 percent in September after having increased 0.2 percent in August. The indexes both for manufacturing and for manufacturing excluding motor vehicles and parts also moved down 0.2 percent in September.

The index for manufacturing decelerated sharply in the third quarter: After having jumped at an annual rate of 9.1 percent in the second quarter, factory output gained 3.6 percent in the third quarter. At 93.2 percent of its 2007 average, total industrial production in September was 5.4 percent above its year-earlier level.

The capacity utilization rate for total industry edged down to 74.7 percent, a rate 4.2 percentage points above the rate from a year earlier but 5.9 percentage points below its average from 1972 to 2009. 

Capacity Utilization looks better to me, no?

And industrial production:


Not too bad.

Bottom line: Overlook the headline number and look at the trend.  Revisions have been upward this year, which would put the number at estimates.  While not incredibly strong, IP and CU are stabilizing and pointing up.  The trend is your friend here.

Thursday, October 14, 2010

Thursday Market Recap

Happy Thursday.  Banks got whacked today as the foreclosure mess took center stage and initial jobless claims rose more than expected.  Market played bank-whack-a-mole in both fixed income and equities, with large bank CDS out 5-20bps and shares down 3-6%.  Earnings mixed, but some positive signs within them (see earlier post on JBHT).  How about some numbers:

Equities:

Smack down on financials, but the rest of the market didn't fare too bad, staples, tech and telecom closed positive.  Still decent on the year though.  Growth/value anyone?

Midcap growth outpaced value, widening the spread between the two.

Given the sector divergence we saw today, correlations within the S&P fell:

On that note, here are asset class correlations (using ETFs):

(trying to find a new source of cross asset correlations, would appreciate any thoughts).

Fixed Income:

Decent day today, with JPM leading the market with size in 10s and 30s ($2.75Bln 10yr +180 and $1.25Bln 30yr +165). Dubai Elec & Water (Ba2/NR) tapped for $2B in 6s and 10s.  Secondary action:

IG advance/decline ratio was 0.57x, financials whacked it and took the most active slots - all down.  HY adv/dec ratio was 1.08x (lower, but still positive) - Ally got whacked and Harrahs kept up the good work.

Steepen it up.

Australian iron-ore mining company Fortescue Metals Group Ltd. is looking to raise US$2 billion in the U.S. and European bond markets, according to two people familiar with the matter, as the miner accelerates its expansion plans to capitalize on the currently high price of iron ore.The Perth-based miner, Australia's third-largest listed producer of iron ore behind global giants Bhp Billiton Ltd. (BHP) and Rio Tinto Ltd. (RTP), refinanced another portion of its debt on Oct. 10 in order to give it flexibility to expand.

Forex:

Dollar breather.  Here's an interesting chart:  commodity duel.


Errata:


Seagate Technology Plc, the world’s largest maker of disk drives, is in talks to be purchased by TPG Capital and KKR & Co., according to people with direct knowledge of the discussions.The private-equity firms are considering an offer of about $16 a share, which would value the company at $7.55 billion, said two of the people, who declined to be identified because the discussions are private. The firms are looking to contribute about $4 billion in equity and may seek other private-equity funds as partners, the people said. The new old thing.  Careful, corporate buyers get a strong COC with an "any" agency downgrade provision.


Four private-equity firms are exploring bids for Northrop Grumman Corp.’s shipbuilding unit, which may draw offers for at least $2.5 billion by a deadline next week, said people with knowledge of the matter.Bain Capital LLC, Carlyle Group, KKR & Co. and TPG Capital have been examining the unit’s finances and meeting with its executives, said the people, who spoke on condition of anonymity because the talks are private. The price may range from $2.5 billion to more than $3 billion, the people said.

More than 100,000 U.S. homes were seized by lenders in September, a record number that probably will decline in coming months as major banks halt repossessions and review their foreclosure practices. Lenders took over 102,134 properties last month, RealtyTrac Inc. said in a report today. That was the highest monthly tally since the company began tracking the data in 2005, surpassing the August record of 95,364. Foreclosure filings, including default and auction notices, rose 3 percent from the prior month to 347,420. One out of every 371 households received a notice.Click your heels three times - its getting better, its getting better, its getting better.

U.S. video game industry sales fell in September, painting a potentially grim picture for the crucial holiday shopping season.U.S. sales throughout for video game software, hardware and accessories fell to about $1.2 billion, a drop of 8% from roughly $1.32 billion in the same month a year earlier, according to market research firm NPD Group. Analyst Anita Frazier said the slowdown particularly hit video game hardware makers, whose sales fell 19% from the previous year. ZAP!


Warren Buffett's Berkshire Hathaway Inc. sold 370,146 shares of Moody's Corp. (MCO), as the conglomerate continues to pare down its stake in the credit-rating company. Thursday's share sale is the latest in a series. Berkshire has been shaving its stake in the company in fits and starts for more than a year. Last month, the company sold nearly 2 million shares. With the latest sale, Buffett's company now has 28.5 million shares of Moody's, while its stake remains about 12%. The sale, at a price of $27.65 per share, was worth $10.2 million. Moody's had about 236 million shares outstanding as of June 30.

Reverberations from the economic crisis are continuing to hit oil and gas drilling in the North Sea as companies focus on cash flow and cost control, said a report from consultancy Deloitte Friday. In Norwegian waters, just seven exploration or appraisal wells were drilled in the third quarter, an unusually large decline of 56% from the same period in 2009, the report said. Across the first nine months of 2010, drilling activity was down 30% on year. Twenty-four exploration and appraisal wells were drilled on the U.K. continental shelf in the third quarter, a fall of 20% on year, the report said. Drilling activity across the first nine months of 2010 was 9% lower on year. 

Bottom line:  Trades remain in place with long midcaps, long intermediate treasuries, short long treasuries, long LQD, long Aussie and Loonie.

Wednesday, October 13, 2010

Walmart - Mr. Rollback Rolls UP

From Time (yes, I know - ewwwww) magazine:

Walmart has rolled back its rollbacks. Earlier this year, the retailer tried to spark sluggish U.S. sales by lowering its prices - already bargains - even further. One analyst called it "an initiative that screams: Price! Price! Price!"
These rollbacks, as they are known in Walmartspeak and in the company's advertising, were intended to overwhelm the shopper. In May, according to one shopping website, the price of a 40-oz. bottle of Heinz ketchup, which had been $2.42, was chopped to $1. Kraft mac and cheese, which had been going for $3.58, was reduced to $2.50. The rollback of a 50-oz. bottle of Tide laundry detergent, which was priced in the $7.48-$8.12 range, gave shoppers a $2.50 discount. Walmart expected a flood of customers to its stores, which would help lift the company's stock out of its rut and get Walmart rolling again.

Instead, cutting prices depressed sales, as shoppers took the bargains and ran. For the quarter ending July 31, Walmart's U.S. same-store sales fell 1.8%. The company's same-store sales have now fallen for five straight quarters. Of the rollback strategy, Bill Simon, the president and CEO of Walmart U.S., told investors at a September conference, "It did not do what we had hoped it would do. It did, however, drive price perception. It did not drive sales or traffic." As a result, Walmart rolled back the deeper discounts, and prices started inching upward this summer. According to a new report from J.P. Morgan, the price of a 31-item basket from a Walmart store in Virginia rose 2.7% in September alone. Walmart prices have jumped 5% since the start of the year and have been at their highest levels in the 21 months J.P. Morgan has tracked pricing data.

Here are my takeaways:  First: Consumers are still hurting, going wherever they can to save a few bucks and not buying other items while doing so.  A penny saved is a penny saved.  Second:  Yes, there will be inflation.  Do what they may, I do not believe the Fed will be able to create growth and maintain price stability simultaneously.

Tuesday, October 12, 2010

Fed Minutes - More Pushing on a String?

Fed minutes from Reuters (emphasis mine):
(Reuters) - Federal Reserve officials believed in September the struggling recovery might soon need more help, and they discussed several ways to provide support, including the possible adoption of a price-level target. Policy-makers had a "sense that (more) accommodation may be appropriate before long," the central bank said on Tuesday.

In minutes of the its last policy-setting session held September 21, the Fed said officials discussed several approaches to aiding the economy but focused on buying additional longer-term Treasury securities and ways to nudge the public into expecting higher levels of inflation in the future.To help shift inflation expectations, policy-makers debated providing more detailed information about what rates of inflation they would prefer, or the possibility of making clear they would tolerate a higher level of inflation on a temporary basis, a policy approach known as price-level targeting.

They also discussed the possibility of targeting a path for GDP growth. 

The September meeting's minutes showed a number of Fed officials were close to pulling the trigger. "Many members considered the recent and anticipated progress toward meeting the committee's mandate of maximum employment and price stability to be unsatisfactory," the Fed said.  Several officials felt that unless conditions improved, they would consider it appropriate to take action soon in hopes of spurring a stronger recovery.

This could be a set up for QE2, but recent comments (see earlier post) might contradict the message.  Always take new comments versus prior comments.  Stocks lift on QEHope.  Myopic.

Friday, October 8, 2010

Gallup Unemployment up 80bps in Sept

From Gallup:

PRINCETON, NJ -- Unemployment, as measured by Gallup without seasonal adjustment, increased to 10.1% in September -- up sharply from 9.3% in August and 8.9% in July. Much of this increase came during the second half of the month -- the unemployment rate was 9.4% in mid-September -- and therefore is unlikely to be picked up in the government's unemployment report on Friday.

 The increase in the unemployment rate component of Gallup's underemployment measure is partially offset by fewer part-time workers, 8.7%, now wanting full-time work, down from 9.3% in August and 9.5% at the end of July.

 This is an interesting chart.  The hardest thing to measure is the underemployed.  If someone loses a high paying (or even median paying) job and ends up working part-time , they are employed, but their earnings (and therefore the multiplier) are significantly lower.

As a result, underemployment shows a more modest increase to 18.8% in September from 18.6% in August, though it is up from 18.4% in July. Underemployment peaked at 20.4% in April and has yet to fall below 18.3% this year.

Gallup also found a hiring turndown (is that a word???) in the second half of the month which may not be included in the NFP report.


I think the bottom line here is that no set of numbers can really give one a firm grasp of the employment situation and its resultant impact on the economy.  I personally believe in just paying attention to the world around you (go to the mall, ask folks about store traffic...).  Yeah, it doesn't fit easily into a model, but look where models got us so far.


Get the rest here:  Gallup Sept

Wednesday, October 6, 2010

Household Spending - or Lack Thereof

Middle Class Slams Brakes on Spending (WSJ) Households in the middle fifth of the population sliced their average annual spending to $41,150 in 2009.
That was down 3.1% from 2007 and 3.5% from 2008. The drop came even as those households' after-tax income remained relatively stable over the two years, at an average $45,199. On average, from 2007 to 2009, they cut spending 20.1% on alcoholic beverages, 15.2% on clothing, and 9.5% on restaurants and other food away from home. They also spent less on some groceries as well as seafood. Spending rose 5.6% from 2007 to 2009 for the poorest fifth of consumers, despite a 5.5% drop in after-tax income to an average $9,956 a household. The lowest earners spent 15.4% more on food last year than in 2007. Among the poor, rent expenditures increased 5.3%. Spending by the richest fifth of consumers fell 2.6% from 2007 to 2009.

Ready for some quick math?

AT Income:    $45,199
Spending:       $41,150
remaining:      $ 4,044


Personally, I think the numbers are wrong.  The 10% implied savings rate is well above the savings rate in the US paygo economy.

Quite the safety net, no?  This would show that the "average" American is one transmission job and a set of braces away from losing the house.   Whats that dear, you want to go to college? 

About Me

A student of the markets that has held portfolio management, analysis and trading positions for over 15 years.